10 SEO Metrics is All You Need
Ian Duncan • 5th Mar 2026

SEO metrics don’t need to be complicated.
Most dashboards are.
They’re stuffed with numbers that don’t change what you do next.
But even with AI reshaping what search visibility means, the fundamentals haven’t changed.
The best metrics still:
- Prompt you to take action; they point to a specific best next step
- Move outcomes; they sit upstream of outcomes you actually care about
If your search metric does neither, it belongs in the ‘noise’ bucket.
3 types of SEO metrics
Every SEO metric below falls into one of these three buckets:
- Input metrics
- System health metrics
- Output metrics
Input metrics measure what you do, stuff that’s in your control, like the number of pages you publish.
System health metrics describe the condition of your SEO system, like whether your content is indexable. An analogy: you could be the world’s best footballer, but if you’ve got a broken leg, none of your skill matters.
Output metrics are the results you want to achieve that you don’t directly control, like organic conversions.
10 SEO metrics to rule them all
So here they are: 10 metrics that help you create a truly actionable SEO report (full explanations included below):
| Metric | What it tells you | Bucket | Target / threshold | |
| 1 | Pages published (defined keyword/topic target) | Are we publishing enough targeted pages to grow visibility? | Input | Set a monthly target (e.g., 4–20 depending on team) |
| 2 | % stale priority pages updated | Are our most important pages obviously up to date? | Input | 100% of freshness-sensitive priority pages updated in last 6–12 months |
| 3 | Topic gap closure rate | Are we filling the missing pieces in our authority? | Input | Close X% of mapped priority gaps per quarter |
| 4 | Structured data coverage (relevant templates/pages) | Have we made key content machine-readable? | Input | 95–100% valid schema where it applies |
| 5 | Link-earning original assets created | Are we producing anything worth citing and linking to? | Input | 1 per quarter (small team) / 1 per month (bigger team) |
| 6 | Indexation readiness rate (priority URLs) | Can Google index the pages we care about? | Health | 100%: 200 OK + indexable + correct canonical + internally linked |
| 7 | 75th percentile LCP (field), mobile + desktop | Do pages load fast for most real users? | Health | ≤2.5s for 75% of users (split mobile/desktop) |
| 8 | Engagement Quality Score (EQS) pass rate (priority pages) | Do people engage enough for the page’s intent and take a next step? | Health | ≥70% Pass+ and ≥20% Strong/Excellent |
| 9 | Internal link coverage (priority pages) | Can users/crawlers find priority pages and do they look “important”? | Health | ≥90% meet linking standard (N + hub links; no orphans) |
| 10 | Organic conversions / value | Is organic search producing the outcomes the business cares about? | Output | Primary KPI: set target; track MoM + YoY |
What counts as a “priority page”?
You’ll note many of these metrics reference priority pages. A priority page is any URL you actively want to rank because it maps to a defined keyword/topic target with evidenced demand (or commercial intent). In practice, this will usually be:
- Key service / category / product templates
- High-intent landing pages
- Strategic guides / comparisons
- Core hub pages in your topical map
For our purposes here, if a URL doesn’t have a keyword/topic target assigned, it can’t be a priority page.
Inputs
1. Number of pages published with a defined keyword/topic target
Are we publishing enough targeted pages to grow visibility?
This is our core metric for content volume, a lever that we fully control.
It makes it easy to understand the rate at which we produce content.
You should only include pages that have a defined keyword or topic target to ensure this metric is meaningful for SEO.
Looking at this either versus your own year-on-year data or versus specific competitors makes it easier to see if you’re producing enough content.
If this number is low, your outcomes will likely not reach their potential.
How to implement: Track monthly count of newly published URLs that have a documented keyword/topic target in your content plan (exclude untargeted posts).
| Prompts action? | ✅ | Yes, track it year-on-year and it’s easy to tell if your content volume is low and needs to be increased. |
| Moves outcomes? | ✅ | Yes, the production of new targeted content directly leads to new content indexation and ranking/visibility potential. |
2. % of stale priority pages updated
Are our most important pages obviously up to date?
This is our content freshness check.
Pages refreshed within the last 6-12 months tend to rank and appear in AI answers more often.
Plus, it’s self-evidently more reassuring to the reader to know they are reading current, up-to-date information (think of how often you’ve checked the date on an article and made a judgement on that alone).
There’s one important nuance: freshness matters most for “evolving” topics — things that change month-to-month, or queries with an implied time context (“best”, “latest”, “2026”, “right now”).
This leaked system prompt text attributed to Claude (from 2025) explicitly instructs the model to prioritise recent sources for evolving topics.
For genuinely evergreen content, freshness is less critical, but you can still usually add a light “current context” pass that keeps it feeling modern.
Because “stale” is always moving (it depends on when content was published), we don’t measure an absolute count. We measure the percentage of stale, freshness-sensitive priority pages updated.
Your goal is to maintain this at 100% for content where you judge freshness matters. Anything below that and you’re leaving search visibility on the table.
And for more evergreen subjects, this metric will at least flag content to check, giving you the opportunity to make a judgement call on whether an update makes sense.
How to implement: Maintain a priority pages list with a last-updated date, define what counts as stale by intent (e.g., 6–12 months for freshness-sensitive), and report the % updated each month/quarter.
| Prompts action? | ✅ | Yes, it’ll prompt you to update specific stale content. |
| Moves outcomes? | ✅ | Yes, refreshing content increases the potential for re-indexation and for LLM-powered chatbots to view that content as up to date. |
3. Topic gap closure rate
Are we filling the missing pieces in our authority?
This tracks the percentage of identified priority gaps that have been published in the last X months (where X should be relative to your content production rate).
This helps you measure strategic completeness of your content coverage, rather than just raw volume.
One of our key SEO goals is for search engines (Google, Bing etc. and AI chatbots that can search the web) to view our website as an authority on our target topic.
To demonstrate authority, table stakes is that we have covered the breadth of the topic space to an adequate degree.
And we must have deep, expansive and original content in certain subtopics to clearly demonstrate subject matter expertise (i.e. the thing that distinguishes our content from everything else out there).
See here for more on topic mapping.
How to implement: From your topic map, tag gaps as “priority”, then each quarter report % priority gaps published in period ÷ total priority gaps.
| Prompts action? | ✅ | Yes, it’ll prompt you to create content that fills in the gaps in your topical authority. |
| Moves outcomes? | ✅ | Yes, it’s measuring the act of closing gaps and the rate at which you are doing so. |
4. Structured data coverage (relevant templates/pages)
Have we made key content machine-readable?
This metric captures how effectively key parts of our content are made machine-readable and extractable.
That matters even more in an LLM-mediated search environment because structured data provides a low-ambiguity way for LLM’s to extract facts, rather than relying solely on their ability to infer meaning from unstructured text.
In classic search, it unlocks rich SERP features. In LLM search, it makes your entities and facts unambiguous, improving the odds you’re represented accurately.
You’ll first need to identify which schemas are relevant to your website, and ensure you are measuring your percentage based on relevant pages rather than all pages of the site. Some popular schemas include Products, Events, How-To, FAQs, Videos, Recipes, Articles/News, and Reviews. View the full list at schema.org.
Given the growing use of LLM-based search, you should aim for 95%-100% coverage where it applies.
How to implement: For each schema type you use (Product, Article, FAQ, etc.), report % of eligible URLs with valid schema using a validator and template-level checks.
| Prompts action? | ✅ | Yes, it tells you exactly which templates/pages are missing schema and what to implement. |
| Moves outcomes? | ✅ | Yes, it increases eligibility for enriched results and improves machine-readable extraction (particularly important for LLM-mediated retrieval). |
5. Link-earning original assets created
Are we producing anything worth citing and linking to?
No, this isn’t the same as the number of pages published.
Link-earning assets are a special category of content. It goes without saying (I hope) that your content should impart significant value to the reader.
You might label that “link-worthiness”.
But that’s not enough.
Your content must lend itself to be linked to (the “link-earning” part).
You need to produce content that other web writers — those with the power to link to you — will want to reference.
You want content that magnetically attracts links.
Typically, that’s content like original research, data tools, reports, and sometimes polemic or opinion pieces.
If you can imagine an industry journalist linking to it to help make a point in their article, then you’re thinking on the right lines.
How to implement: Define what qualifies (original research/data/tool/report), log each asset published, and count them per month/quarter as a separate production line from “normal pages”.
| Prompts action? | ✅ | Yes, it drives a specific production agenda (research/data/tools) rather than “more blogs.” |
| Moves outcomes? | ✅ | Yes, these assets are disproportionately likely to attract editorial links/mentions, which remains one of the strongest external authority signals. |
Health
6. Indexation readiness rate (priority pages)
Can Google index the pages we care about?
This is a hygiene factor. If the pages you care about aren’t indexed, then none of the other metrics matter.
By ‘priority’ pages we mean those that are important for SEO because they have the potential to attract organic traffic. You can codify that as pages with a defined keyword or topic target that has associated search demand.
A priority page is “indexation ready” when it passes all of the checks below:
- The page returns a 200 status code (not a 3xx redirect, 4xx, or 5xx).
- The page is indexable
- The canonical points to the correct indexable URL (often itself), and isn’t incorrectly canonicalising to a different page/variant
- The page can be discovered via internal links from indexable pages
Indexation readiness rate = % of priority pages that pass all four checks.
This metric should always be at 100%.
How to implement: Run a monthly crawl of priority URLs and score each as pass/fail on: 200 OK + indexable + correct canonical + internally linked, then report % passing.
| Prompts action? | ✅ | Yes, fix noindex/robots, canonicals, redirects, 404/5xx. |
| Moves outcomes? | ✅ | Yes, it’s a gating factor for visibility. |
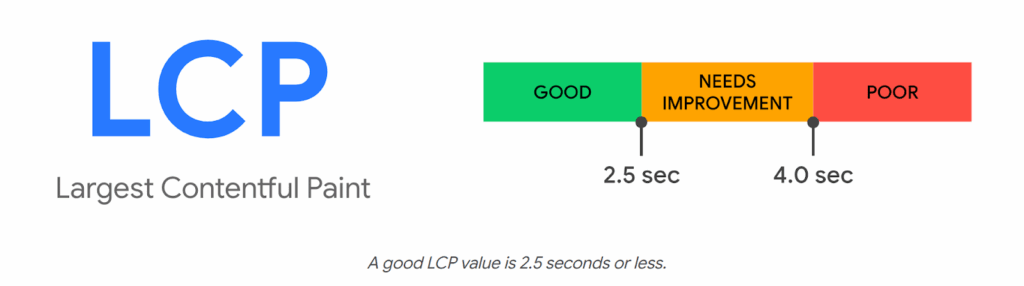
7. 75th percentile LCP, mobile & desktop
Do pages load fast for most real users?
LCP (Largest Contentful Paint), measures perceived load speed. It does this by looking at how long it takes for the largest, most important visual content in the viewport to load (e.g. hero image, text block, video).
Measuring the 75th percentile LCP tells us how fast the page loads for most real users, including those on slow connections.
Put another way, for a page to meet the “good” LCP threshold, the largest in-viewport content element should render within 2.5 seconds for at least 75% of users.
The metric should be segmented by mobile and desktop because mobile will almost always hit performance bottlenecks sooner than desktop.
You can measure real-world LCP using Google’s CrUX Vis tool. For diagnostic testing you can use the Lighthouse tool.
How to implement: Pull 75th percentile LCP from CrUX for key templates/priority URLs, split mobile vs desktop, and track trend against the ≤2.5s threshold.
| Prompts action? | ✅ | Yes, it prioritises performance work (image/video optimisation, render-blocking resources, fonts, server response). |
| Moves outcomes? | ✅ | Yes, in a second-order effect kind of way; it impacts user experience and can affect rankings and engagement; it’s especially meaningful on mobile, where slower internet is more likely. |
8. Engagement Quality Score (EQS) pass rate
Do people engage enough for the page’s intent and take a next step?
EQS is a lightweight intent-alignment check: does a priority page hold attention long enough for its intent, and do users take a next step?
What you measure (per page)
- Time sufficiency rate = % of visits that reach the “sufficient time” threshold for that page’s intent.
- Progression rate = % of visits that trigger a meaningful next step (intent-appropriate).
Intent thresholds
These are defaults you can start with. The minimum sufficiency rate refers to the percentage of users that should meet the “sufficient time” threshold.
| Intent type | Typical user mindset | “Sufficient time” threshold | Minimum sufficiency rate |
| Awareness | Skim, Explore | ≥ 10s | ≥ 45% |
| Understanding | Learn, Orient | ≥30s | ≥50% |
| Evaluation | Proof, Compare | ≥60s | ≥60% |
| Decision | Act | ≥10s | ≥30%-35% |
(Calibrate to your site after 4–8 weeks of baseline data.)
Progression events (examples)
- Awareness → click to related guide / hub / newsletter
- Understanding → view pricing/service detail / download
- Evaluation → view case study / comparison / product detail
- Decision → form submit / call / purchase / donation
Scoring
- Fail: time sufficiency rate < threshold OR progression rate < threshold
- Pass: meets both thresholds
- Strong: comfortably above thresholds (set your own “buffer”, e.g., +10–20%)
- Excellent: top performer on both metrics; protect and replicate
What EQS tells you
- Low time, low progression: mismatch, poor structure, wrong promise, slow page, weak above-the-fold.
- High time, low progression: engaging but under-signposted; strengthen CTAs and next steps.
- Low time, high progression: people are “escaping” fast; check if the page is acting as a thin doorway.
Why it’s worth it
EQS turns messy engagement data into a page-level triage list. It joins the dots between search visibility and on-site user experience, helping you figure out what to rewrite, or re-structure next.
How to implement: In your web analytics (e.g. GA4), classify priority pages by intent type, track key “progression” events (the next steps you want users to take), then report the % that meet (a) intent-specific time-sufficiency threshold and (b) a defined progression event rate.
| Prompts action? | ✅ | Yes, it tells you which pages are confusing or under-signposted for their intent type, prompting you to improve them. |
| Moves outcomes? | ✅ | Yes, improving intent alignment increases progression and conversion propensity. |
9. Internal link coverage (priority pages)
Can users/crawlers find priority pages and do they look “important”?
SEO doesn’t just depend on what you publish. It depends on whether your site connects your priority pages in a way that helps users and crawlers find them and treat them as important.
Internal linking is one of the few SEO levers that is:
- under your control
- repeatable
- scalable across the whole site
You get to decide how each page is connected and therefore how link equity flows between pages.
You can define internal link coverage as the percentage of priority pages that meet a minimum internal linking standard, for example:
- Have ≥ N unique internal links pointing to them (where N is based on your site size*)
- Receive links from relevant hub pages
* As the site grows, your internal link graph gets sparser by default. To account for this you calibrate N accordingly:
- Small site (<500 indexable pages): N = 5
- Mid (500–5,000): N = 10
- Large (5,000+): N = 20
How to implement: From a crawl, compute for each priority URL whether it meets your linking standard (≥N unique internal referring pages + at least one relevant hub link) and report % passing.
| Prompts action? | ✅ | Yes, add links from hub pages, related-content blocks, and high-authority pages, and eliminate orphaned priority pages. |
| Moves outcomes? | ✅ | Yes, internal links affect crawl paths, discovery speed, and how much authority your site funnels into pages that need to rank and convert. |
Outputs
10. Organic conversions / revenue
Is organic search producing the outcomes the business cares about?
This is ultimately the output the business or organisation cares about. It grounds your SEO work in commercial value (leads, sales, donations, etc.).
The growth of LLM-powered chatbots gives organic visibility renewed importance.
I’d go so far as to say LLMs are a great thing for SEO — they’ve opened up the conversation with budget-holders that allows SEO to come out of the shadow of PPC.
Users are increasingly using AI chatbots to help with research and product consideration (things they used to do via Google). And with the adoption of agentic commerce standards (like Google’s Universal Commerce Protocol), there is a potentially closed loop between prompt and purchase.
Let’s be clear, a meaningful share of agent-completed purchases will be influenced by organic visibility, because agents still need high-confidence, crawlable facts and inventory signals from the open web.
How to implement: In your web analytics (e.g. GA4), define your primary organic conversion(s) and value, then report MoM + YoY for organic channel groups.
| Prompts action? | ✅ | Yes, but indirectly; it prompts investigation into which upstream levers (inputs/health) changed. |
| Moves outcomes? | ❌ | No, it’s downstream; it’s the outcome you’re trying to influence! |
Where is metric X?
If your favourite search metric isn’t on the list, forgive me — it’s an opinionated list, and 10 is a nice round number.
That said, I’ll address a few notable omissions:
Why organic sessions isn’t in the list
For years SEOs have obsessed about getting organic traffic — the “more, more, more” mentality.
But the search paradigm is changing.
There’s a growing volume of “dark” organic search happening within the walled gardens of AI chatbots.
Google is also a big culprit, attempting to keep users within its platform with AI Overviews (remember they have a commercial imperative to keep users’ eyes on their Ads).
Both are examples of so-called zero-click search.
They mean a lot of businesses have seen organic traffic drops, and with increasing chatbot adoption that trend is likely to continue.
So, I’m not saying don’t measure organic sessions. It’s a number you absolutely should know.
But it’s not the reliable measure of organic visibility and performance that it once was.
Where are rankings?
Rankings can be useful but they’re not a good core metric.
Fundamentally, they move because of inputs and system health (and competitor and SERP changes), not the other way round.
They’re also volatile and easy to obsess over.
That said, they can be helpful for direction of travel and triage.
If you want one rankings-style number to check progress, you would be better served using a constrained version:
Priority query coverage (Top 3 / Top 10) — the % of your priority queries sitting in the visibility zone.
This answers the question: “Which pages are stuck in positions 4–10 and need a second pass?”
Where are all the AI visibility metrics?
They are there. See “input metrics” above.
If you were hoping to see stuff like Citation Count, Brand mentions, AI share of voice, Vector index presence, (or something else plucked from the AI hype train) then I’d be happy to discuss why they are (mostly) snake oil.
But this article is kind of long already, so I’ll just refer you back to the intro where we covered what makes a good metric.
What next?
If you’re reporting SEO to budget-holders, these 10 metrics are all you need.
They show what mix of “publish, fix, or improve” is needed to grow your organic visibility. And they tie your SEO back to business outcomes.
Put them on a single page and review them monthly; your best next steps will become obvious.
If you want an SEO agency partner to help you set it up (and drive your numbers forward), get in touch.